Microsoft Excel is a utility that is widely used in many companies and enterprises. The realities are such that almost any employee must, to one degree or another, be proficient in Excel, since this program is used to solve a very wide range of tasks. When working with tables, it is often necessary to determine whether certain variables are related to each other. For this, the so-called correlation is used. In this article, we will take a closer look at how to calculate correlation coefficient in Excel. Let’s figure it out. Go!

Let’s start with what the correlation coefficient is in general. It shows the degree of relationship between two elements and always ranges from -1 (strong inverse relationship) to 1 (strong direct relationship). If the coefficient is 0, this indicates that there is no relationship between the values.
Now, having dealt with the theory, let’s move on to practice.
Determination of the coefficient through the “Function Wizard”
To find the relationship between the variables x and y, use the built-in Microsoft Excel function “CORREL”. To do this, follow these steps:
- Select the cell where the calculation result will be displayed, and click on the function wizard button (it is located next to the field for formulas).
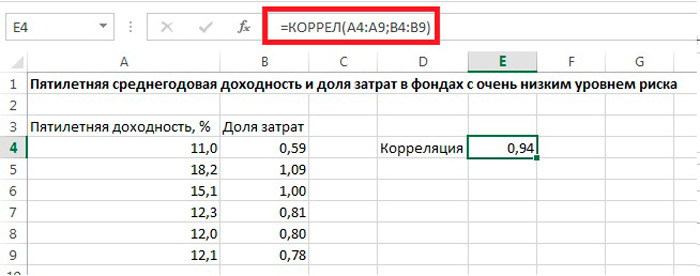
- In the window that opens, select from the list of functions “CORREL” and click “OK”.
- After that, in the function arguments window, set the range in the “Array1” and “Array2” fields. For example, for Array1, highlight the y values, and for Array2, highlight the x values.
In our example, in the line “Array1” we enter the coordinates of the range of cells of the value, the dependence of which must be determined (in our case, these are sales revenues). To add the address of the array to the field, select the cells in the column. In the line “Array2” you should enter the coordinates of another column (in our case, this will be the envisaged advertising budget). Below in the item “Value” you can immediately see the result of the calculation. After adding data to the “Array1” and “Array2” fields, click “OK”.
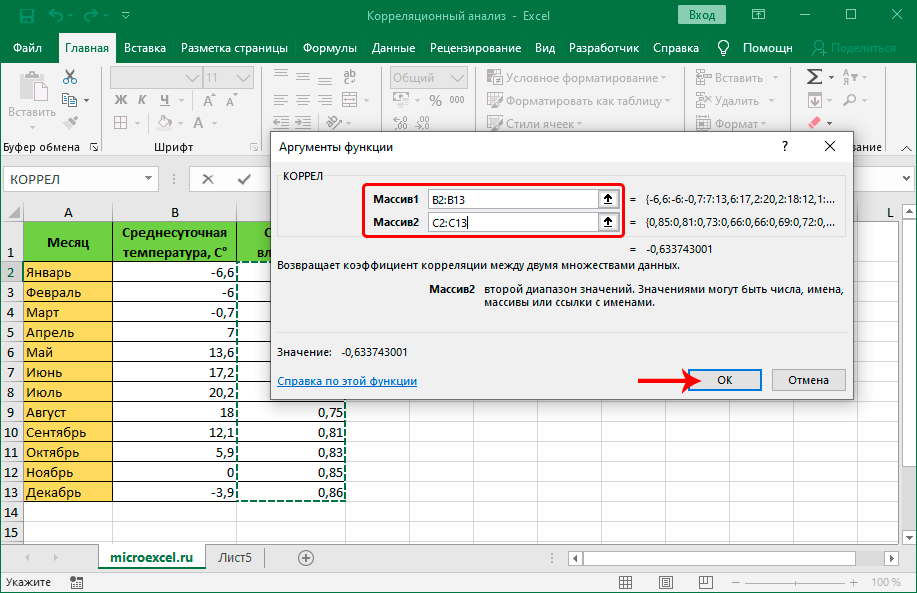
- As a result, you will receive the correlation coefficient calculated by the program in the previously selected cell.
In our case, the indicator is average, the dependence of profitability on advertising is not impressive, although it is definitely present.
Calculation of correlation using the tools of the analysis package
The correlation dependence can also be calculated using a special tool, having previously activated it. To complete the task, you will need to perform the following manipulations:
- Go from the File menu to the Options section.

- In the menu on the left go to the “Add-ons” section.
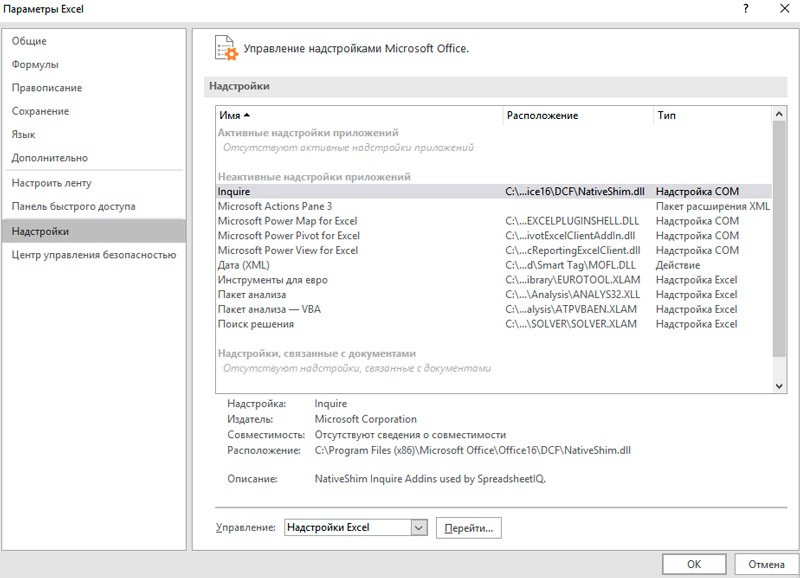
- At the bottom of the window, in the “Management” block, you need to set “Excel Add-ins” (if set otherwise, change) and go to the add-ins.
- In the add-on window that opens, mark the “Analysis package” and click “OK”, which allows you to activate the toolkit.

- Now go to the “Data” tab – another block of “Analysis” tools will be available on the ribbon. Here click on “Data Analysis”.
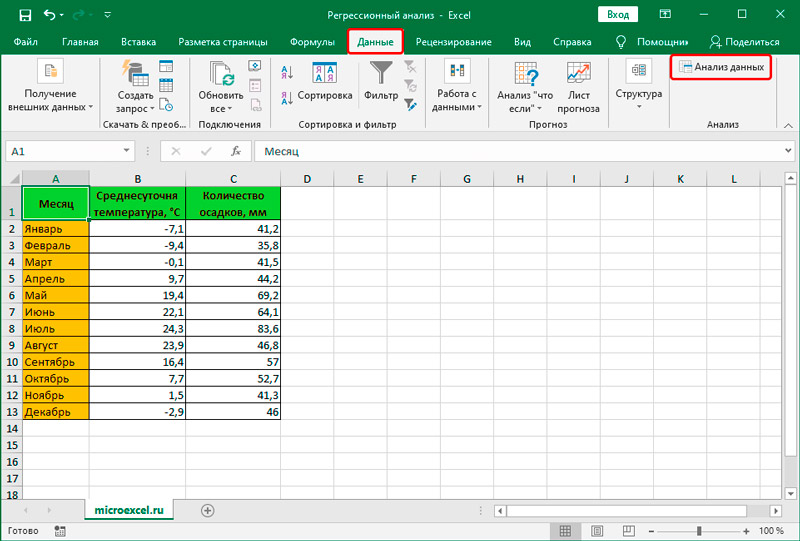
- Select “Correlation” among the options offered and click “OK”, after which the necessary settings will be available.
- In the window that opens, in the line “Input interval”, you should enter the interval of all the columns involved in the process of calculating the dependence at once.
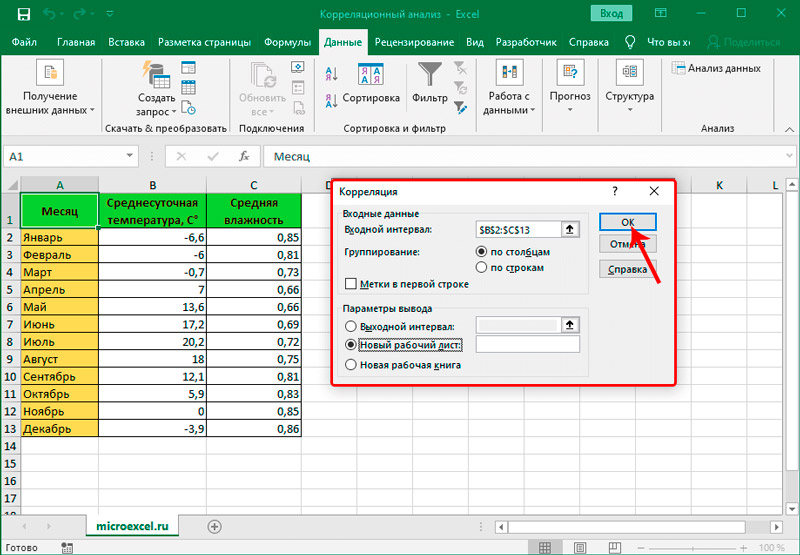
- Leave Grouping as Columns, because in our example the data is divided into columns, not row by row.
- In the parameters of the output of the results, you can leave the default “New worksheet” (the data will be displayed on a new sheet) or select “Output interval” and specify the coordinates of the cells in the line so that the coefficient appears in the specified place on the page. You can also display the total of calculations in a new workbook by moving the marker to the appropriate item.
- After setting the necessary settings, click “OK” and get the results of the work performed. It will not differ from what was obtained using the first calculation method, because although the steps are different, the program performs the same calculations.
The correlation coefficient is calculated by the program
Calculation of the correlation dependence by the formula
The next method will be relevant for students who are required to find dependence according to a given formula. First of all, you need to know the average values of the variables x and y, after which, based on the data obtained, you can calculate the relationship:
- Highlight the variable values and use the AVERAGE function.
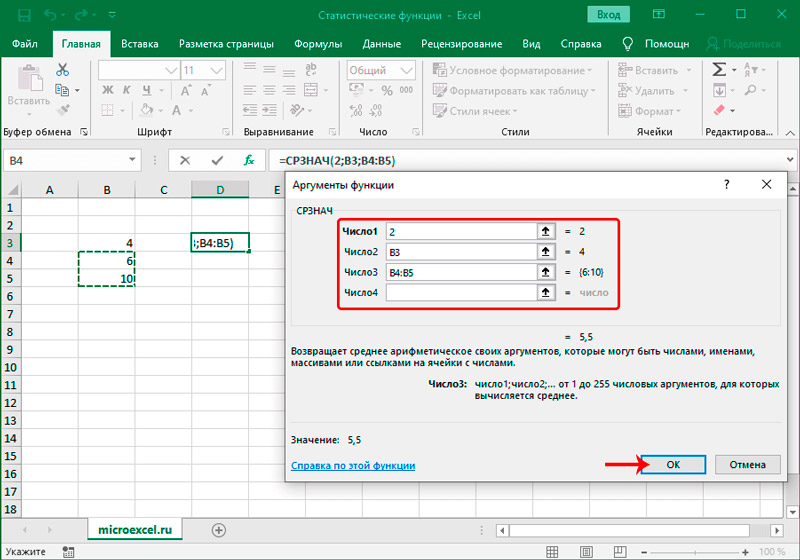
- Next, you need to calculate the difference between each x and x av, and y av . In the selected cells, write the formulas xx, y-. Don’t forget to freeze the cells with averages. Then stretch the formula downward so that it applies to the rest of the numbers.
- Now that you have all the data you need, you can calculate the correlation. Multiply the resulting differences as follows: (xx avg ) * (yy avg ). After you get the result for each of the variables, add the resulting numbers using the autosum function. This is how the numerator is calculated.
- Now let’s move on to the denominator. The calculated differences must be squared. To do this, enter the formulas in a separate column: (xx av ) 2 and (yy av ) 2 . Then stretch the formulas to the full range. Then, using the “AutoSum” button, find the sum for all columns (for x and for y).
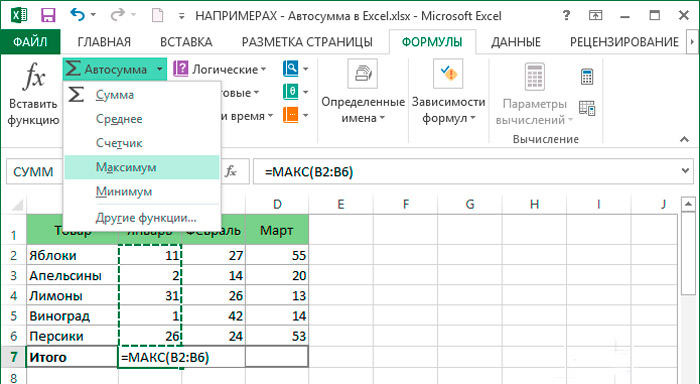
- It remains to multiply the found sums and extract the square root from them.
- The final step is to divide the numerator by the denominator. The obtained result will be the desired correlation coefficient.
As you can see, knowing how to work correctly with the functions of Microsoft Excel, you can significantly simplify the task of calculating complex mathematical expressions. Thanks to the tools implemented in the program, you can easily do correlation analysis in Excel in just a couple of minutes, saving time and effort. Write in the comments if the article helped you to understand the issue, ask about everything that interested you on the topic considered.