Almost every user is familiar with critical errors of the “window” OS, and the blue screens of death (BSoD) that appear at the same time usually do not bode well. They can be triggered by software or hardware reasons, and since the source of the trouble is not always obvious, the solution begins with diagnostic measures.
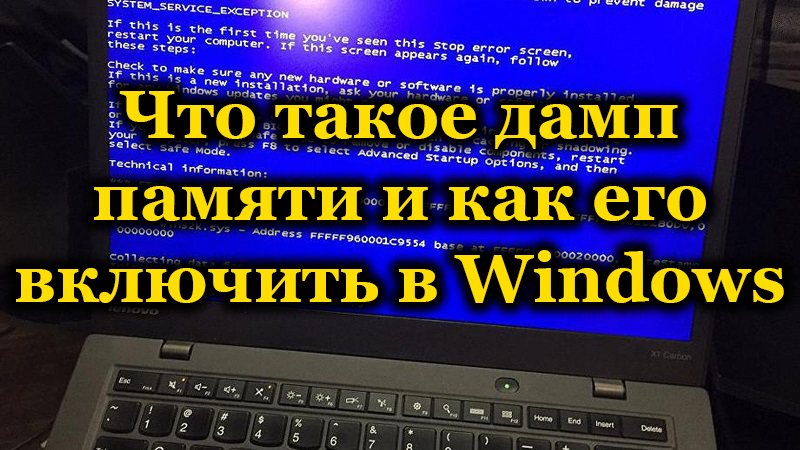
Fixing an error can be tricky, and often the most useful tool for diagnosing the cause of a failure is a memory dump, which is a snapshot of the operating system’s RAM with debug information. Moreover, in Windows, the automatic creation and saving of memory dumps to the hard disk is not always activated, while in fixing BSoD, regardless of the nature of the failure, this data can greatly help.
Contents
What is a Windows memory dump for?
The contents of the RAM and materials related to the crash can be written to the swap file, the next time the operating system starts, an emergency dump is created with debugging information generated from the saved data (the OS can create a memory dump bypassing the swap file). An error entry will be made in the event log if this option is configured.
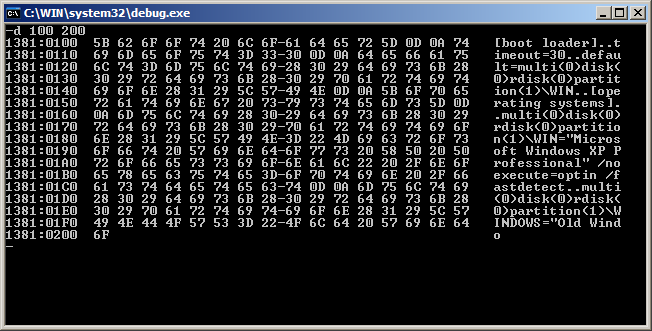
Outputting a dump section of a 32-bit Windows OS using the Debug.exe program
The type of the recorded dump can be set in the OS properties, the following options are supported:
- Small memory dump. It includes a little information, in particular, this is an error code with parameters, a list of drivers installed in Windows, etc., but this information is enough to identify the source of the problem. The item will usually be written to the C: Windows Minidump directory .
- Kernel memory dump. This saves kernel-mode information only, excluding information that does not indicate the source of the failure.
- Complete system dump. The content is the entire memory of the operating system, which can create problems when creating a snapshot if the amount of RAM is more than 4GB. Usually written to the file C: Windows MEMORY.DMP .
- Automatic memory dump (became available from the eighth version of Windows). Contains the same entries as the kernel memory dump, but differs in the way the system manages the paging file size.
- Active memory dump (presented in the “Top Ten”). Contains only the active host memory from the kernel and user modes * (the feature was originally implemented for servers to prevent virtual machines from being dumped during diagnostics).
* A user mode dump is a dump of a specific process. So, the content can be the complete memory of a process or a fragment, a list, a stack, the state of threads, lists of libraries, the state of threads, descriptors of kernel objects.
Most often, a Windows 7, 8, 10 crash dump is used for diagnostic purposes and allows you to figure out how to fix a critical error. By analyzing the content, you can understand what caused the problem and start fixing it.
How to enable memory dump on Windows
To activate automatic saving memory dump in Windows, you need to do the following:
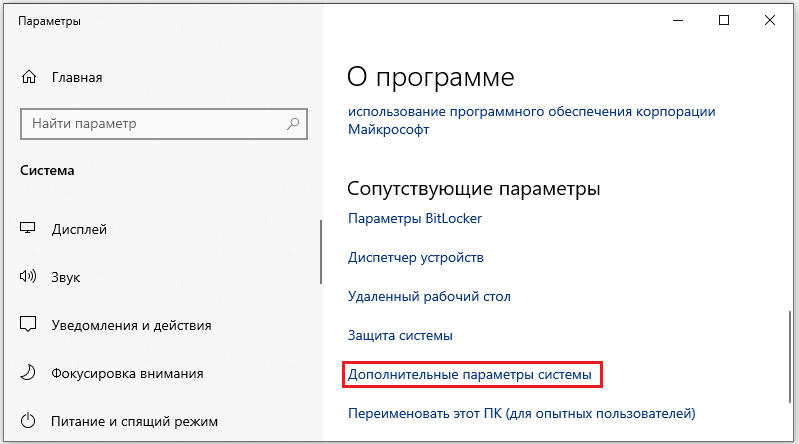
- We pass to the properties of the system in any convenient way. For example, right-click on the “My Computer” icon (or “This Computer” on the “Top Ten”). Select “Properties”, then in the list of options in the left column, click “Additional system parameters”. An alternative option is to use the Control Panel, where you should go to the “System” section (the same window will appear when using the Win + Pause keys), and then to “Advanced system settings”. In Windows 10, you can also use the Options snap-in (Win + I). In the window you need to go to the section “System -” About the system “-” Information about the system “and then to the additional parameters of the OS.
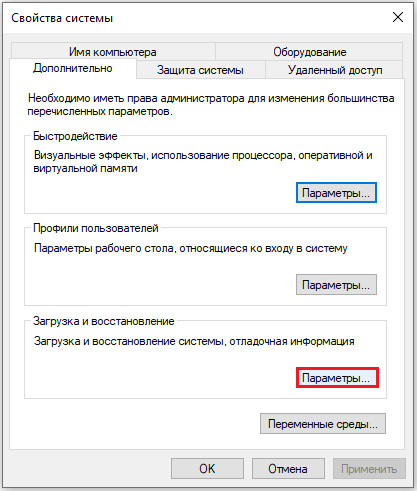
- In the window that opens, on the “Advanced” tab in the “Startup and Recovery” area, click “Options”.
- As a result of the manipulations, the following window will open, where you should select the type of debug information recording, set the parameters by ticking the necessary items, and then click the “OK” button.
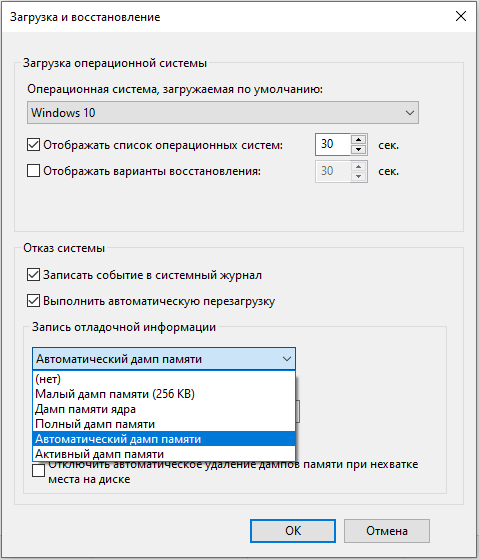
How to set up a memory dump in Windows
The settings for the actions taken when the OS crashes are performed in the same window as enabling the creation of a memory dump (“Startup and Recovery”), where we get from the system properties.
Here you can configure the OS startup parameters and assign certain actions in case of its failure, for example:
- specify the dump recording mode with debug information (automatic is selected by default, but the value “No” can be set);
- write events to the log (entries are added to the logs);
- the checkbox “Perform automatic reboot” allows the system to reboot after a failure and continue to function;
- if the option “Overwrite existing dump file” is selected, the object will be overwritten with every error that appears.
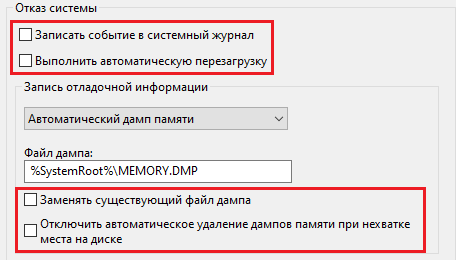
When using an SSD, it is better to leave the “Automatic memory dump” recording type, but if you need a crash dump file, it is better to set “Small memory dump”, it is the easiest and it is easy to send it to another user if you need help analyzing the state.
Sometimes it may be necessary to increase the size of the paging file more than is available in the RAM in order to make it fit the full dump.
You can read the memory dump using specialized utilities such as Microsoft Kernel Debugger, BlueScreenView and others.
Installing WinDbg on Windows
The utility, which is a debugger for usermode applications and drivers, allows you to analyze a snapshot of memory and find out what triggered the BSoD. It is delivered as part of the Windows 10 SDK , the installer is downloaded from the Microsoft website. For 7 and earlier systems, WinDbg can be found in the Microsoft Windows SDK for Windows 7 and NET Framework 4.
Install WinDbg:
- go to the SDK download page (depending on the OS version, select the required package, the links above), download the installer;
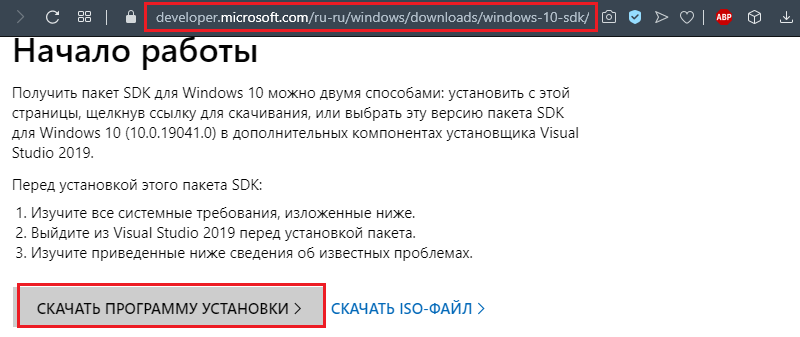
- after downloading the file, start the installation process;
- choose the first installation option – on this computer (the second involves downloading to install the package on other computers);
- leave the default installation path or change, if necessary;
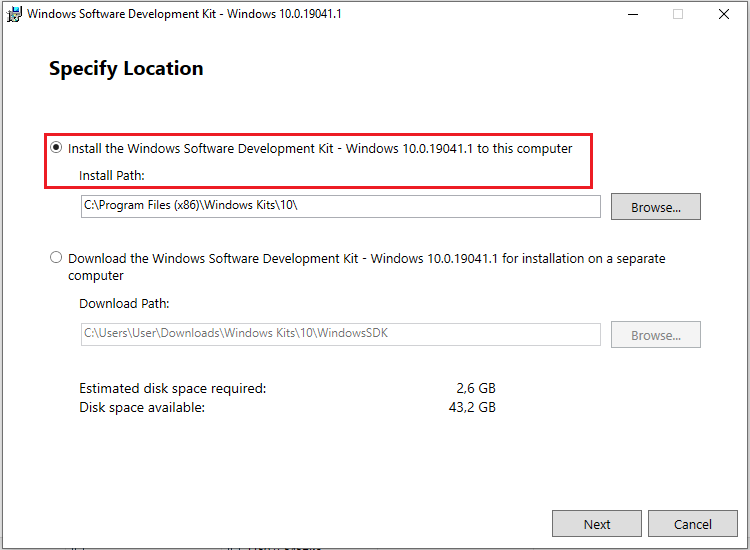
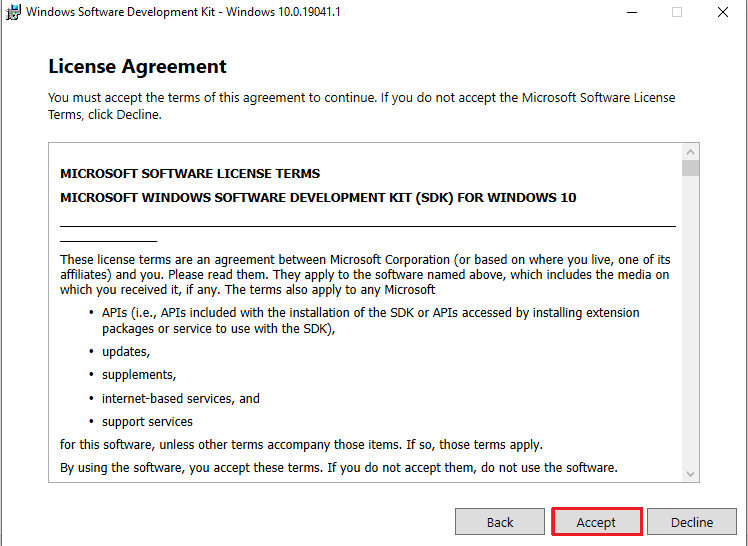
- agree to the terms of the license agreement;
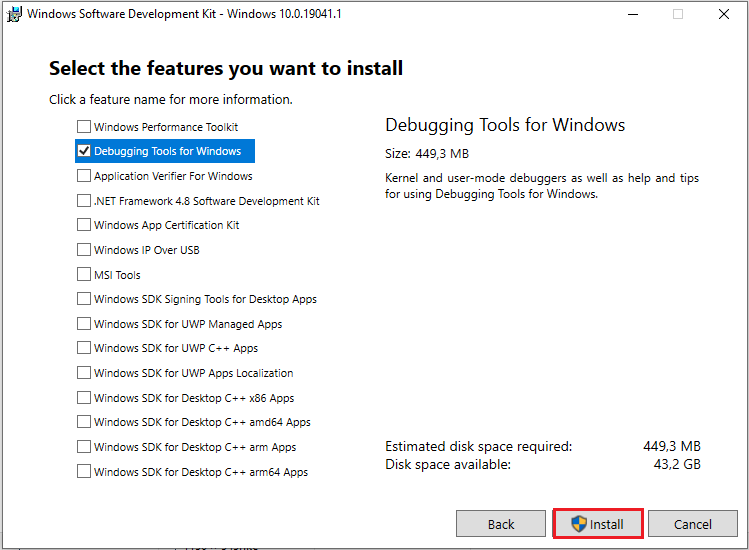
- you can install the entire package or select only the Debagging Tools for Windows debugger from the list.
Crash dump analysis in WinDbg
Before parsing a memory dump, you need to make some adjustments. To work with the software, you will need the Debugging Symbols package of debugging symbols, loaded taking into account the version and bitness of the system.
You can configure the utility to extract symbols from the Internet, which is safe, since it uses an official Microsoft resource.
Associating .dmp Files with WinDbg
In order for objects to open when you click on them using the utility:
- In the command line console, run as administrator (for example, through the Start menu), execute the commands (depending on the OS bitness):
cd C: Progran Files (x86) Windows Kits 10 Debuggers x64
exe –IA - Or (for 32-bit Windows):
cd C: Progran Files (x86) Windows Kits 10 Debuggers x86
exe –IA

Now files of types .DMP, .HDMP, .MDMP, .KDMP, .WEW will be associated with the application.
Setting up a debug symbol server
Debug symbols that are generated during the compilation of the application along with the executable file are needed for debugging. Configuring WinDbg to extract symbols from the network:
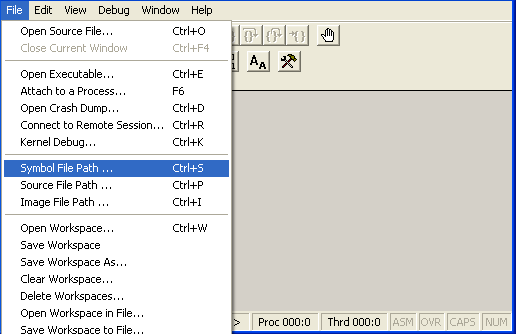
- in the WinDbg window, press “File” and select “Symbol Fie Path …” or press Ctrl + S;
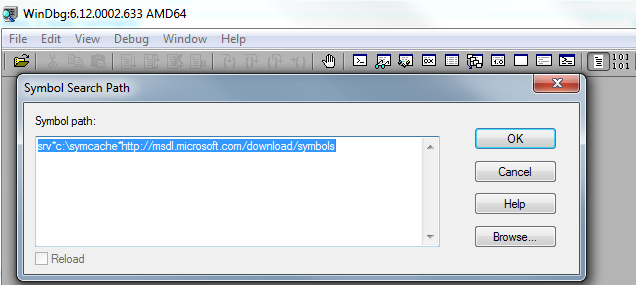
- specify the path for loading by writing the line:
SRV *% systemroot% symbols * http: //msdl.microsoft.com/download/symbols
- apply adjustments by clicking “File” – “Save Workspace”.
Parsing memory dump in WinDbg
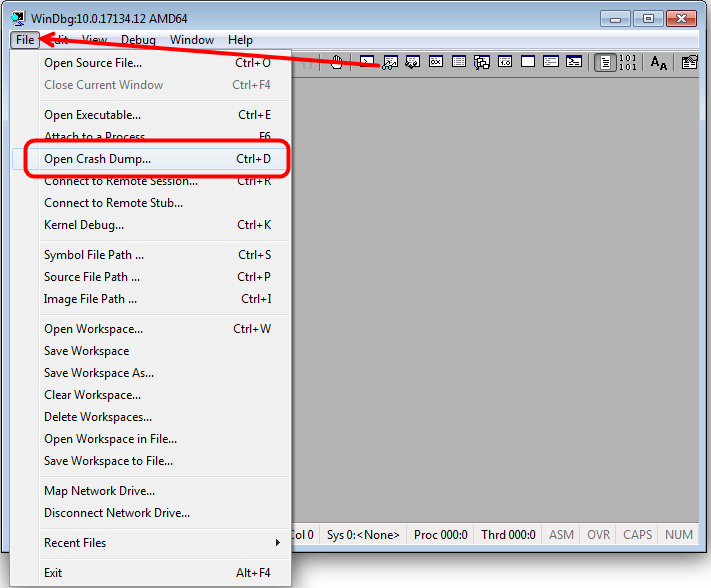
To go to the procedure, open the object in the utility (File – Open Crash Dump) or, if file associations were previously configured, open the item with a mouse click. The utility will start analyzing the file, then display the result.
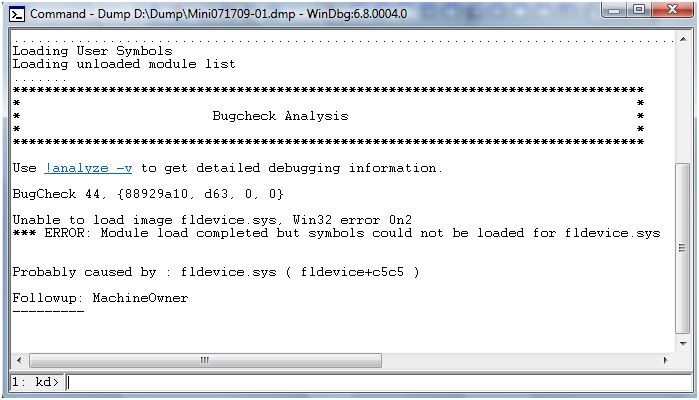
The window is supposed to enter commands. The “! Analyze –v” query will provide more detailed information about the crash (STOP code, error name, command stack that led to the problem, and other information), as well as recommendations on how to fix it. To stop the debugger in the program menu, click “Debug” – “Stop Debugging”.
How to delete memory dump files
If you need to delete a memory dump, you can do this manually by following the path of the object’s location on disk. For example, in the Windows system directory, you need to find and delete the MEMORY.DMP file, as well as items in the Minidump directory. In addition, you can use the standard tool of the “Disk Cleanup” system:
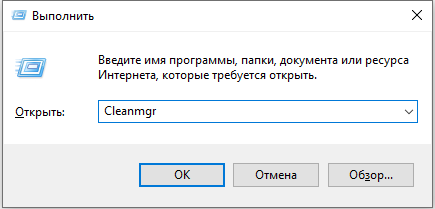
- we call the console “Run” (Win + R) and enter the command ” Cleanmgr” to go to the service;
- press the button to clear system files, then find and mark in the list the lines concerning memory dump. If not, then they were not created.
Snapshot creation is disabled, even if you have ever activated this function due to the activity of special software. If we are talking about an SSD drive, these can be programs for working with solid state drives. Disabling some OS options is performed by them in order to optimize performance, since multiple read / write processes reduce the lifespan of the disk. Also, the reason for disabling the memory dump can be various programs for cleaning your computer and optimizing the system.